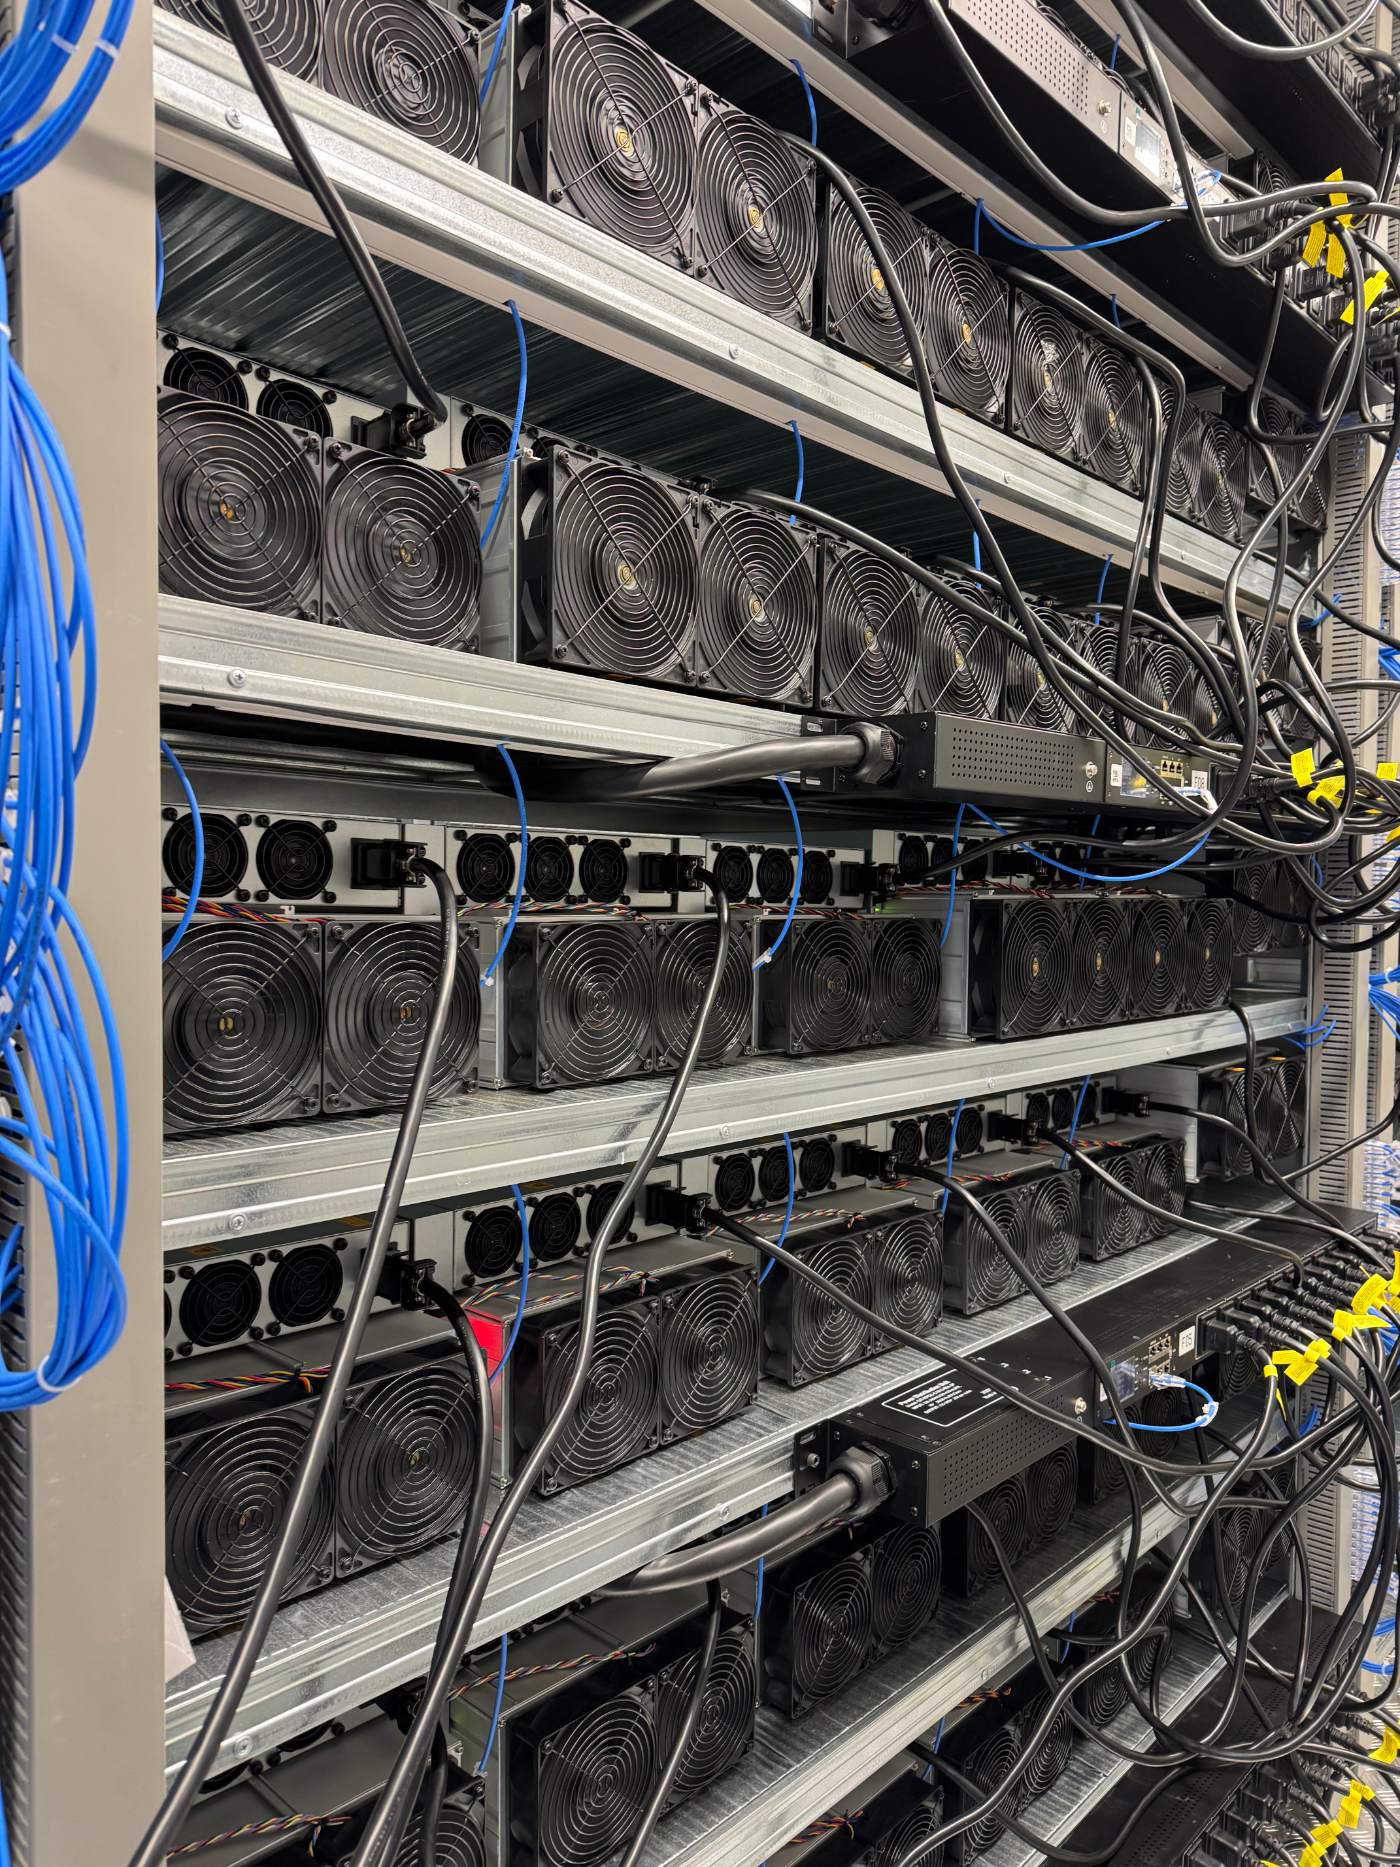
Per-unit power, temperature and status, live rather than in a monthly export. What a hosting customer should have access to, and why.
Can you check what a single unit in your fleet is doing right now, or only what a monthly report told you it did weeks ago?
What per-unit visibility should include
For a fleet hosted with someone else, the information to have at the unit level is simple: power draw, temperature and current status (online, offline, idle or throttled). That is enough to tell you whether a unit is working normally, working under stress, or not working at all, without needing anyone to interpret it for you. A dashboard that only shows a fleet total hides exactly the detail you would need if one rack, one row, or one unit is behaving differently from the rest. A fleet total answers a different question. It is not a substitute for per-unit data once something needs investigating.
The same applies to history, not only the current reading. A unit that has been intermittently offline for short stretches over several days looks identical to a healthy unit in a snapshot taken at any single moment, and only shows up as a problem once you can see the pattern across time. Ask whether the per-unit view includes a recent history you can scroll back through yourself, or only the current state, because the two answer different questions and a dispute usually turns on the history rather than the snapshot.
Live access, not a monthly export
A monthly export tells you what happened. It does not tell you what is happening, and by the time an anomaly shows up in a report, whatever caused it may already be resolved, unresolved and worse, or impossible to reconstruct from the data you were given. Live access means you can check a unit's status the moment you have a reason to, rather than waiting for the next scheduled export to confirm something you already suspect. Ask whether the dashboard on offer updates close to real time, or whether it is a periodic pull assembled specifically for the report, because those are different systems even when they draw on the same underlying data.
This distinction matters most when something has already gone wrong on your side (an unexpected result, a firmware rollout you are partway through, a rack you suspect is running hot) and you need to confirm quickly whether the cause sits with your hardware or with the site. A live view lets you rule out one side of that question within minutes. A monthly export leaves you waiting for the next cycle to say anything at all, by which point the useful moment to act has usually passed.
Alerts, and who receives them
An alert is only useful if it reaches someone who can act on it while they can still act on it. Ask what triggers an alert, whether it goes to you, to the operator, or to both, and whether there is a difference between an alert you can silence yourself and one that only the operator controls. A unit going offline overnight is a different kind of event depending on whether you find out when it happens or when you next log in days later. If alerts exist only on the operator's side, ask how and when that information is expected to reach you, and whether that path is written into the agreement or left as a courtesy that depends on someone remembering to mention it.
Then ask what happens between an alert firing and a person looking at it. An alert that lands in an inbox nobody checks over a weekend behaves, in practice, like no alert at all. Ask whether alerts route to a monitored channel with someone on call, or to a mailbox that gets read on the next business day, because the gap between those two answers can be the entire length of an outage.
Your own units and the wider site view
Running a site involves data beyond any one fleet: whole-site power and cooling, security systems and the aggregate load of every tenant. Other customers' data stays with them, but that is no reason to give you less than full visibility into your own hardware. The reasonable line is simple: whatever the operator sees about your units, you see as well.
The site-level view adds context a single fleet cannot provide: whether an anomaly on one unit is isolated or matches a pattern across the site, and whether it correlates with a cooling event, a grid event, or nothing external at all. A good host shares that context when it is relevant to your hardware, rather than treating site-wide data as something a customer has no reason to hear about. If a host cannot explain why a piece of data about your own units is not available to you, ask about it directly rather than assuming there is a good reason behind it.
What to ask before you sign
A short list, asked before the contract rather than after an incident, covers most of what matters:
- What per-unit values does the dashboard show, and how often do they refresh?
- Is this the same data the operator works from internally, or a simplified view built for customers?
- What triggers an alert, and does it reach you directly or only the operator?
- Can you pull your own historical data whenever you want it, or only on request?
Missing visibility rarely matters until a dispute puts weight on it, at which point the side with a live record has the shorter conversation. How availability is defined and measured over time is a related question, and uptime and availability, defined sets out the terms to know before you compare two agreements on that basis.
At our facilities, customers see the same dashboards we do, with power draw and temperature monitored in real time and alerting on threshold breaches, as set out on our operations page.