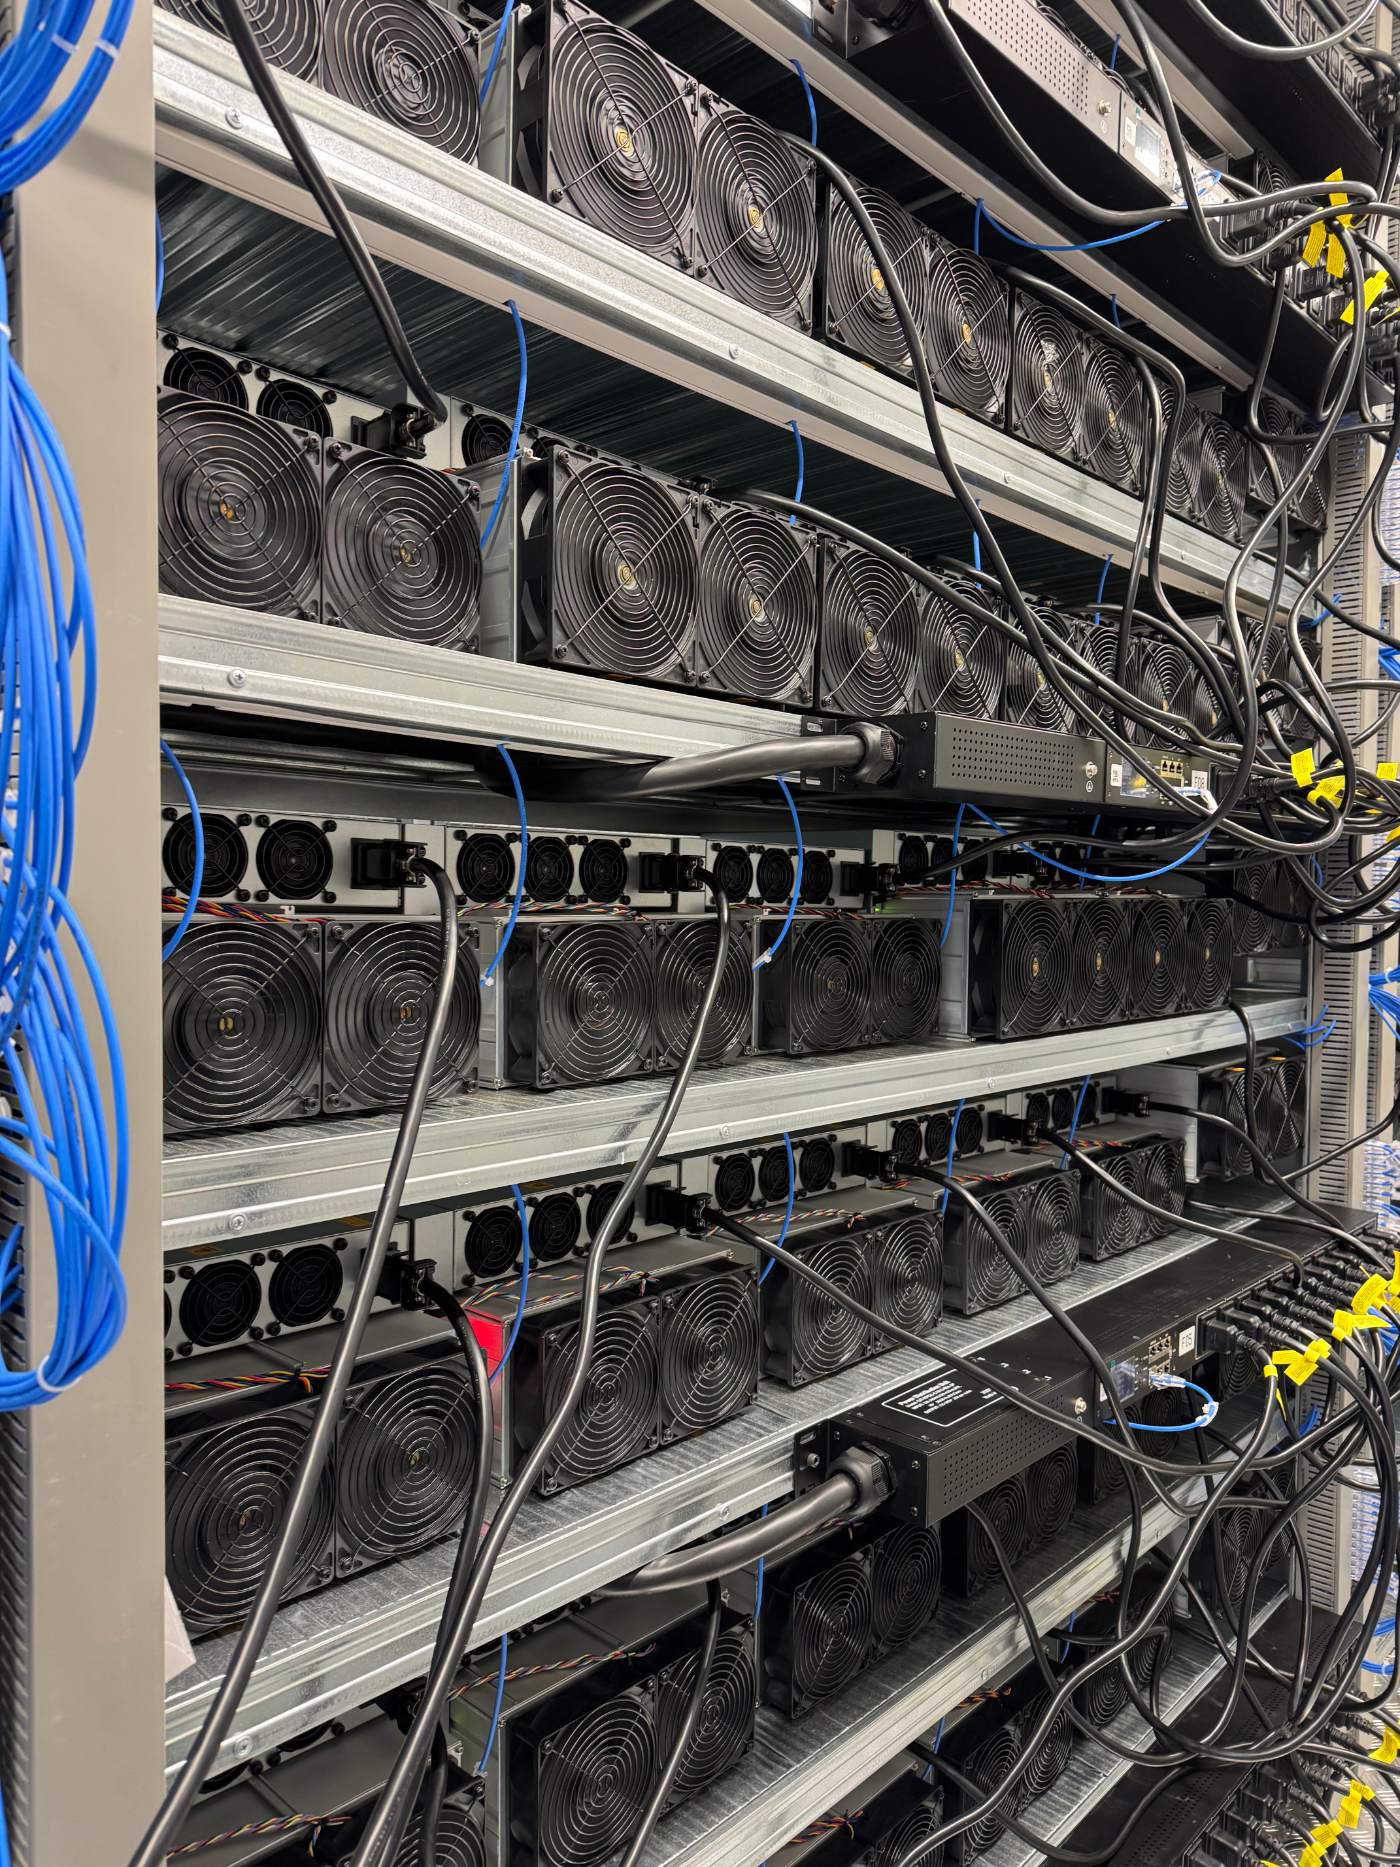
Why there is no single normal failure rate for hashboards, power supplies and fans, how to build one from your own fleet, and when a trend points at the site.
A handful of units go down in the same week and the question that follows is always the same one: whether this is normal or something is wrong. There is no industry-wide number that answers that for you, and anyone who quotes one with confidence is quoting a figure that depends on the fleet's age, its environment and the definition of "failure" they happen to be using that day. What you can build, and what does answer the question, is a baseline drawn from your own fleet's own history.
What tends to fail first, and why
Three subsystems account for most of the attrition in an ASIC fleet: hashboards, power supplies and fans. They fail for different reasons and on different timelines, which is the first thing to separate out before you look at any aggregate number.
Fans are mechanical and wear continuously from the day they start spinning. Dust loading, bearing wear and duty cycle all shorten their life, and a fan running in a dustier or hotter airflow path will simply wear faster than one that is not, regardless of the age on the unit as a whole. Power supplies fail on a different curve: they carry electrical stress, and that stress spikes with voltage instability, heat and the ordinary strain of thousands of on-off cycles over the unit's life. Hashboards fail for a mix of reasons, some of it thermal cycling, some of it manufacturing variance that shows up early, some of it degradation that only appears after a long stretch of continuous operation. Because the three subsystems have different failure mechanisms, a fleet-wide "failure rate" that lumps them together tells you less than tracking each one separately.
Age and environment sit underneath all three. A newer batch of hardware typically shows a small early bump as manufacturing defects surface, then settles into a lower steady rate, then climbs again as components age past their expected working life. Where that unit sits physically (its airflow path and its position relative to intake and exhaust) and the ambient conditions it runs in all shift the curve earlier or later. That is no criticism of a site. It is the reason a fleet spread across different batches, ages and positions will never produce one flat number, and why the number itself is less useful than the shape of the curve over time.
Building a baseline from your own data
The baseline you want is not an industry figure. It is what your own fleet does in a normal month, built from your own records over a long enough window to smooth out noise. That means tracking failures by subsystem, not as a single combined tally, and tracking them against the denominator that matters: units of that subsystem currently in service, not the fleet as a whole.
Per subsystem, the weekly rate is failures ÷ units in service. A few months of clean data, recorded consistently, gives you a range rather than a single figure: a normal week looks like somewhere between this many and this many hashboard failures, this many power supply failures, this many fan failures. That range is specific to your batches, your positions and your environment, and it is the only number to compare this week's count against. An industry average, even a reliable one, is comparing your fleet to someone else's batches, someone else's airflow and someone else's climate.
Scatter versus a trend
Once you have a range, the next question is whether a given week sits inside it or outside it, and whether an outlier is scatter or the start of a trend. A single bad week inside an otherwise flat baseline is normal variation. Fans do not fail on a schedule, and a cluster of three or four in the same seven days can happen inside a fleet that is otherwise stable. What to watch for is a sustained climb: several consecutive weeks each higher than the last, or a rate that settles at a new, higher level and stays there rather than reverting. That shape, a step change or a steady climb rather than a single spike, is the signal that something in the underlying conditions has changed, and it deserves investigation well before the number reaches a level that would alarm anyone looking at it cold. A workable rule is to flag any subsystem whose weekly rate sits above your range for three consecutive weeks.
When the cause is the site and not the hardware
A rising trend does not automatically mean the hardware is bad. The same climb can be produced by a site-side change: a cooling system running warmer than it used to, a filter overdue for replacement and letting more dust through, a voltage stability issue upstream of the units, or a change in airflow caused by nearby equipment or a reconfigured row. The tell is usually in the pattern rather than the count. Hardware-driven failure tends to track with batch and age: units from the same delivery, installed around the same time, failing at a similar point in their life regardless of where they sit. Site-driven failure tends to track with position: units in a particular row, a particular rack height, or a particular airflow zone failing at a higher rate regardless of their age or batch.
Separating the two means asking the operator for data that is broken out by both dimensions, not just a fleet-wide count. You want failures tagged by position on the floor and by installation batch, so you can check whether the climb tracks with where a unit sits or with when it arrived. An operator who can hand you that breakdown, rather than a single aggregate figure, is showing you how the site is instrumented as much as anything about the failures themselves.
What to ask and what to track
Before treating any week's number as meaningful, get the following in place:
- Failure counts by subsystem (hashboard, power supply, fan), not combined
- A denominator of units currently in service for that subsystem, not the whole fleet
- Records going back far enough to establish your own normal range
- Failures tagged by installation batch and by physical position on the floor
- A distinction, in whatever reporting you get, between a single bad week and a multi-week trend
Ask your host how they record this, whether the breakdown by position and batch is something they already track, and whether you can see the raw counts rather than a summarised rate. A site that can hand you that data as a matter of course is easier to evaluate than one that can only offer a headline number.
Nothing replaces a proper look at your own fleet's history, and there is no shortcut that turns someone else's figures into your baseline. Our hardware intake process covers how units are logged from the point they arrive, which is where this kind of record-keeping has to start, and our operations page describes the monitoring and monthly written reports that sit on top of that record.